
From the IGES archive · 1974, 1981 and 1984
To locate an earthquake, a seismologist needs to know how long its waves take to reach each station. Three works written at our institute answered that question for the Armenian Highland: a monograph by N. K. Karapetyan in 1974, an article by A. A. Saakyan in 1981 and his dissertation in 1984. Below they are side by side, with a calculator and the records of 21 November 2026.
1974
Travel-time curves of seismic waves for earthquakes of the Armenian Highland
N. K. Karapetyan · Academy of Sciences of the Armenian SSR, Institute of Geophysics and Engineering Seismology · Yerevan, 1974 · edited by V. G. Papalashvili
- 120earthquakes, records of Caucasian stations from 1933 to 1964
- 5.78 km/sP-waves in the upper crust; S-waves 3.37 km/s, ratio 1.72
- about 52 kmcrust: an upper layer of 37 km and a “basaltic” layer of 15 km
- 0–50 kmtravel-time tables and curves for focal depths 0, 10, 20, 30, 40 and 50 km
The epicentres used to build the curves were found by methods that do not depend on a travel-time curve. The new curves were then tested on two strong earthquakes, in Zangezur in 1968 and near Yerevan in 1973: both foci were found at depths of about 10–14 km.
1981
Epicentral corrections to the standard Jeffreys–Bullen travel-time curve for the Armenian Highland
A. A. Saakyan · Izvestiya of the Academy of Sciences of the Armenian SSR, Earth Sciences, vol. 34, no. 5, pp. 75–81 · Institute of Geophysics and Engineering Seismology · 1981
- 474earthquakes of 1968–1973 with energy class above 9, epicentres known to within 10 km
- 8,467P-wave arrivals compared with the world Jeffreys–Bullen tables
- +1.4 saverage delay against the world tables: the crust of the Caucasus differs from the one Jeffreys assumed by about 15 km
- 2 regionsnorth (Javakheti) and south (Ardahan–Kars, Bardogh–Kotur, Zangezur), with delays of 0.96 and 1.68 s
From these delays Saakyan built tables of P-wave travel times from 10 to 600 km for each region. On four test earthquakes the new times fitted the arrivals better than the Levitskaya–Lebedeva curve. The article ends with the problem we return to today: the new times improve the epicentres, but they do not yet give the depths of the foci.
1984
Kinematic features of P-waves for earthquakes of the Armenian Highland
A. A. Saakyan · dissertation for the degree of Candidate of Physical and Mathematical Sciences, abstract · Yerevan, 1984 · work done at the Stepanavan seismic station · supervisor N. V. Kondorskaya
- 8,467P-wave arrivals: 474 earthquakes of 1968–1973 at 31 stations of the Caucasus
- 48 kmcrust in four layers of 6, 8, 13 and 21 km
- 7.94 km/sP-waves at the crust–mantle boundary
- about 500earthquakes given focal depths with the new curve and station corrections
Each station received its own correction, from −1.5 to +1.0 seconds. With them, 93% of the epicentres were located to within 10 km. The corrections also showed the thickness of the crust under 20 stations of the Caucasus and blocks of faster and slower rock inside it.
The travel-time curve, live
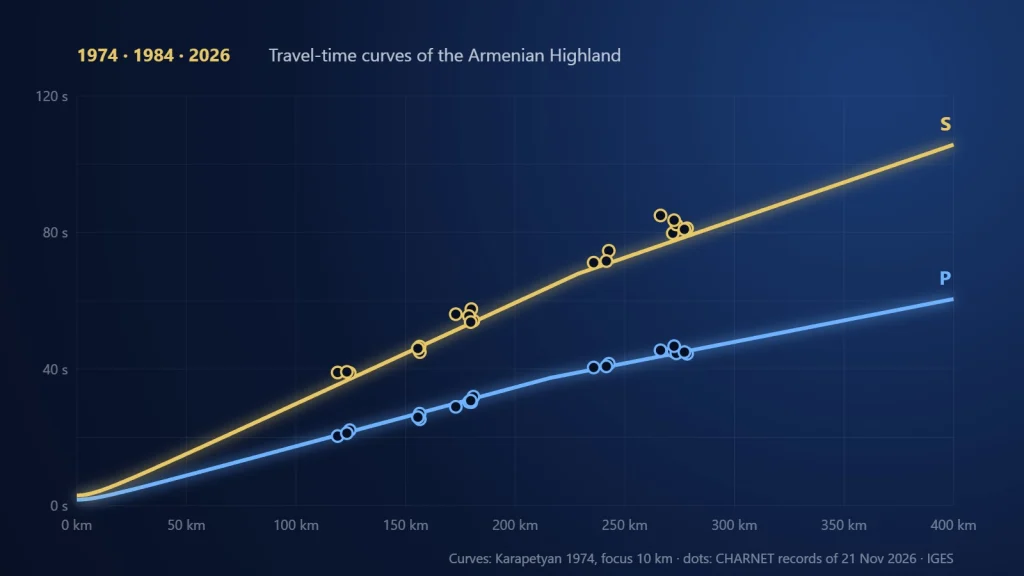
Choose a model and a focal depth. The bold line is the first wave to arrive at each distance; the thin lines are the other waves. Dots are the arrivals recorded by our stations for the three earthquakes on the Turkey–Iran border on 21 November 2026.
Distances of the recorded arrivals are measured from the EMSC epicentres; the origin time of each earthquake is fitted to the chosen curve. The 1984 work gives P-wave velocities only, so S-waves are shown for the 1974 model alone. Layers are drawn flat, as in both works; the station corrections of 1984 are not included.
Two pictures of the crust
Karapetyan, 1974
Saakyan, 1984
P-wave velocity in each layer, in km/s. Below the crust lies the mantle.
Why it still matters
The crust under Armenia is thick: about 50 kilometres in both works. In a thick crust the wave that travels along the mantle boundary overtakes the direct wave only far from the source. With the 1974 model this happens at about 215 kilometres for a focus 10 km deep. For the earthquakes of 21 November 2026, the first waves at Elpin, Antarashat, Byurakan and Nerkin Jorja came through the crust, and at Gyulagarak, Shaghik and Deghdzavan along the mantle boundary. A location program has to know which wave it is reading, and these two works give that answer for the Armenian Highland.
Travel-time curves for the Caucasus
- 1899The first seismic station in the Caucasus opens in Tbilisi; Baku follows in 1903.
- 1932Stations in Yerevan, Grozny, Sochi and Pyatigorsk start the regional network of the Caucasus.
- 1953A. Ya. Levitskaya and T. M. Lebedeva publish a travel-time curve for the whole Caucasus from 19 earthquakes. N. K. Karapetyan builds the first curves for the Lesser Caucasus from 26 earthquakes, for focal depths of 0, 15 and 30 km.
- 1974Karapetyan’s refined curves for the Armenian Highland: 120 earthquakes, depths from 0 to 50 km.
- 1981Saakyan compares 8,467 P-wave arrivals with the world Jeffreys–Bullen tables and finds the waves about 1.4 s late; the Highland splits into a northern and a southern region.
- 1984Saakyan’s regional curve with station corrections, from 8,467 arrivals of P-waves.
- 2026The CHARNET network of IGES records earthquakes in Armenia and around it; the arrival times on its records can be checked against both curves.
Sources
Karapetyan N. K. Travel-time curves of seismic waves for earthquakes of the Armenian Highland. Yerevan: Publishing House of the Academy of Sciences of the Armenian SSR, 1974 (in Russian).
Saakyan A. A. Epicentral corrections to the standard Jeffreys–Bullen travel-time curve for the Armenian Highland. Izvestiya of the Academy of Sciences of the Armenian SSR, Earth Sciences, 1981, vol. 34, no. 5, pp. 75–81 (in Russian).
Saakyan A. A. Kinematic features of P-waves for earthquakes of the Armenian Highland. Abstract of the dissertation for the degree of Candidate of Physical and Mathematical Sciences. Yerevan, 1984 (in Russian).